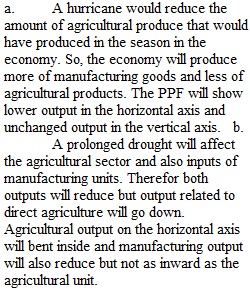
Q ECON 201 HOMEWORK 1 Summer I, 2022 Due May 6th, 2022 Chapters 1 and 2 I. Production Possibilities For each of the following situations, show how you would represent the production or production possibilities change experienced by the country. Start out by drawing a PPF for the country with agricultural goods in the horizontal axis and manufactured goods on the vertical axis and with the assumption that resources are not identical in production. a) Show how you would represent the impact Hurricane Dorian had on the Jacksonville area. Explain briefly why you believe your picture changes in the way you illustrated. b) Show the effect that a prolonged drought. Explain briefly why you believe your picture changes in the way you illustrated. c) Economic statistics indicate that unemployment in Spain has risen from 8.6% in the first quarter of 2018 to 25.02% in the fourth quarter of 2018. Show how you would represent the impact of this dramatic increase in unemployment in Spain. Explain briefly why you believe your picture changes in the way you illustrated. d) Congress is currently considering a new immigration policy that would allow people with the entrepreneurial skills and the money to start new businesses permission to emigrate to the U.S. if they start a business in this country that employs at least 5 U.S. workers. Show how you would represent the impact of this policy on the U.S. Explain briefly why you believe your picture changes in the way you illustrated. II. Gains from Trade Suppose the following table provides the production possibilities for the only two countries in the world. These two countries can produce only these two goods. Assume resources are identical in production. Use this information to show how trade benefits the world and the two individual countries. Also assume the countries are able to produce with no idle resources and no production mistakes (Use a ruler to draw PPFs, you only need two panel (one for each county) to answer the entire question). Silver Diamond Australia 180 270 Canada 180 90 a) Illustrate the production possibilities for these two countries by drawing their PPF, with silver measured on the horizontal axis and diamonds measured on the vertical axis. b) Show the actual production levels of each country assuming the countries are self?sufficient and don’t trade with each other and allocate half of their resources to the production of each good. Label this point a on the graphs. c) Who has the absolute advantage in producing silver and who has the absolute advantage in producing diamonds? Explain how you determined this. d) Who has the comparative advantage in producing silver and who has the comparative advantage in producing diamonds? Clearly show exactly how you were able to determine this. e) What would be your trade advice to these two countries? (i.e. who should specialize in what good?) f) Illustrate your trade advice by showing the free trade production levels of each country on its PPF. Label this point b. g) Use the following table to show how free trade with these countries following your trade advice benefits the world. What is the “gains from trade”? What gives rise to this gain in world?wide production? Self-sufficient and no trade Specialize and free trade Silver Diamond Silver Diamond Australia Canada World h) Give a viable trade agreement for these two countries, which shows that both countries are better off with this trade agreement. How much silver will Australia end up consuming and how many diamonds will it end up consuming? How much silver will Canada end up consuming and how many diamonds will it end up consuming? Show this consumption point for each country on its graph. Label the free trade consumption point with the point c. i) For Australia, give a list of who wins from this free trade agreement (and why they win) and who loses (and why they lose). Hint: These are the groups you should consider 1. Silver Producers in Australia 2. Silver Producers in Canada 3. Diamond Producers in Australia 4. Diamond Producers in Australia 5. Consumers for each good in each country
View Related Questions